Cobalt Interactive cut monitoring costs by 58% through log volume and retention tuning
A 52-person interactive studio was ingesting 1.9 TB of logs a month, most of it noise. Filtering at source, sampling and tiered retention cut ingestion to 520 GB and monitoring spend from ₹2.4L to ₹1L a month.
- Gaming and interactive app studio
- 52 people · Growing
- Kolkata
- 4 weeks
Monthly spend
- Saved / month
- ₹1.4L
- Reduction
- 58%
- Payback
- 3 weeks
−58%
Monitoring spend
−73%
Log volume
₹16.7L
Annual saving
None
Platform change
The challenge
Cobalt's game backends logged every request at debug level, and all logs were kept hot for 30 days. The monitoring bill had become larger than the hosting bill for two of its titles.
The team did not want to switch platforms; they wanted to stop paying for noise.
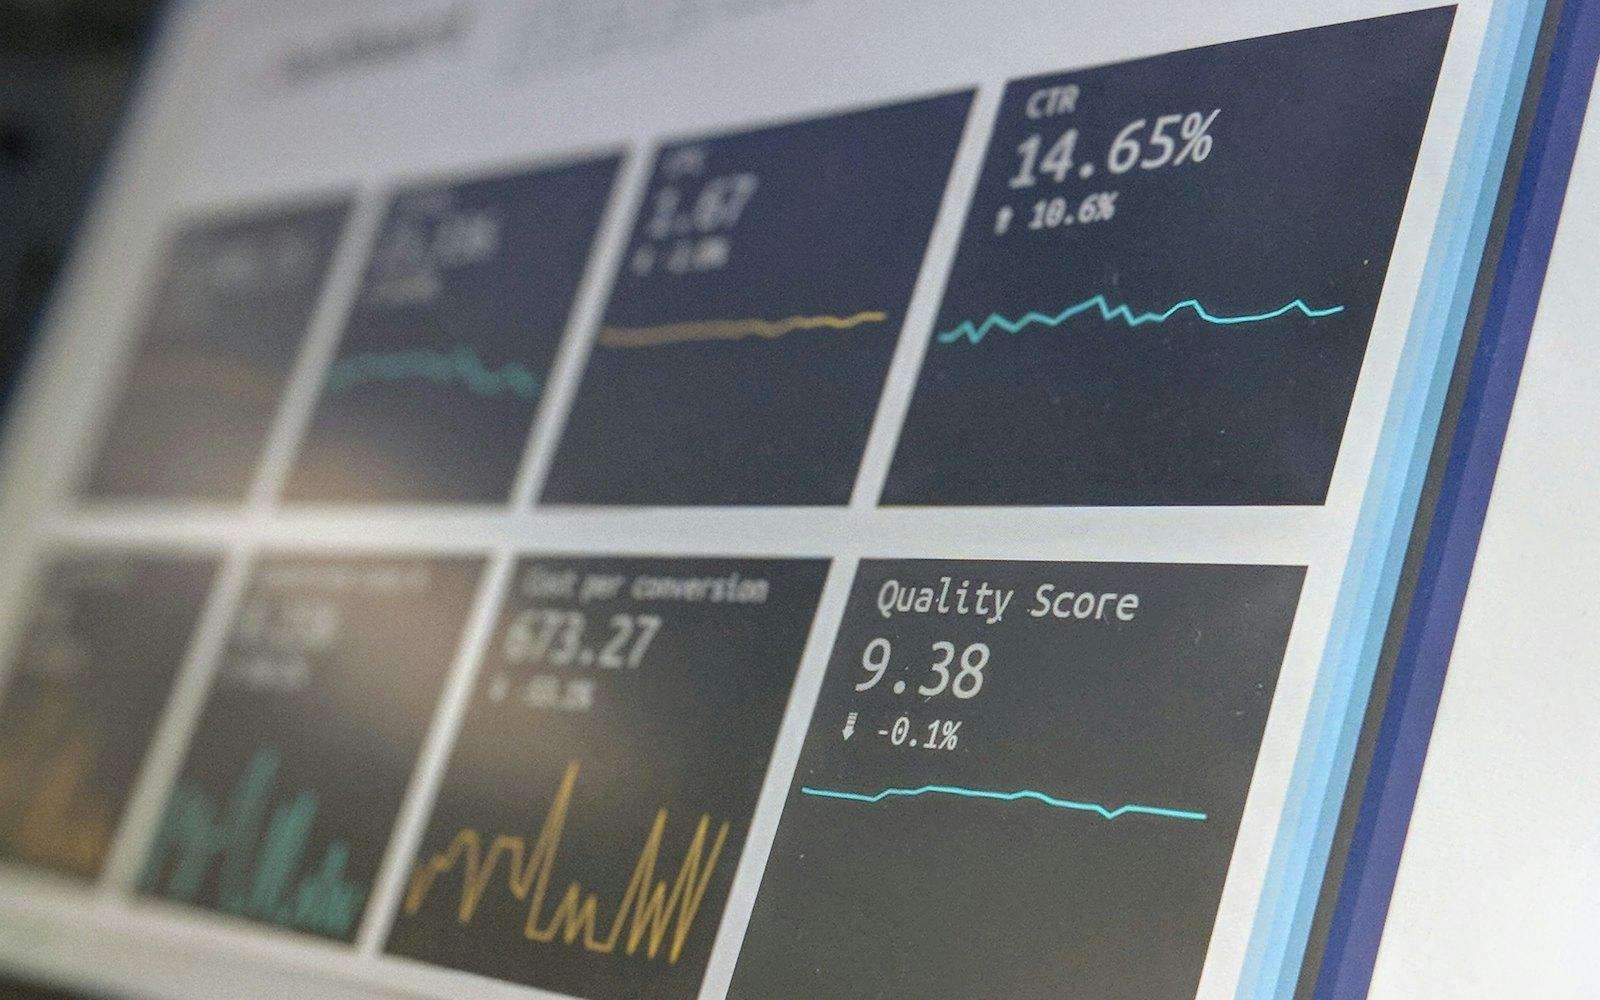
What we reviewed
- Log volume by service, level and message pattern
- Retention settings and how often old logs were queried
- APM sampling rates
- Custom metric cardinality
- Alerting rules and on-call usage
The approach
- 1
Find the noisy 10%
Five message patterns from three services produced 61% of all log volume. They were filtered or sampled at the source.
- 2
Right-level the logs
Production logging moved from debug to info, with on-demand debug for incident investigation.
- 3
Tier retention
Seven days hot, 90 days in low-cost archive with rehydration on demand.
- 4
Tame metric cardinality
High-cardinality labels such as user IDs were removed from custom metrics.
Before and after
Monthly cost by line item, in Indian rupees.
Cobalt Interactive — monthly observability spend
Monthly| Line item | Before | After | Saving |
|---|---|---|---|
| Log ingestion (1.9 TB → 520 GB a month) | ₹1,22,000 | ₹38,000 | −₹84,000 |
| Log retention and archive | ₹38,000 | ₹9,800 | −₹28,200 |
| APM and tracing | ₹46,000 | ₹31,000 | −₹15,000 |
| Custom metrics | ₹22,000 | ₹12,000 | −₹10,000 |
| Alerting and on-call | ₹12,000 | ₹10,000 | −₹2,000 |
| Total | ₹2,40,000 | ₹1,00,800 | ₹1,39,200 (58%) |
Monthly spend over time
₹16.7L saved per yearTwo months before the engagement, then six months after the plan was delivered.
Timeline
Week 1
Volume analysis
Log patterns ranked by cost.
Week 2
Changes designed
Filters, sampling and retention tiers agreed with each team.
Week 3
Plan delivered
Configuration changes and logging guidelines handed over.
Week 4
Support
Changes rolled out and verified against alerts.
“We didn't change tools, we just stopped paying to store noise. Our dashboards are cleaner and the bill is less than half.”
Related case studies
All case studies Observability
Monthly spend
$2,500 → $310
Clarity Softworks · 85 people · Dubai, UAE
Clarity Softworks replaced a $2,500/month monitoring bill with a self-hosted stack
Read case study DevOps & CI/CD
Monthly spend
₹3.2L → ₹1.2L
Fingate Solutions · 140 people · Mumbai
Fingate Solutions cut CI/CD build costs by 62% with caching and self-hosted runners
Read case study DevOps & CI/CD
Monthly spend
₹3.6L → ₹2.3L
Veridian Tech · 48 people · Chandigarh
Veridian Tech saved 35% by streamlining pipelines and consolidating tools
Read case studyFind out what your agency could save
Book a 20-minute call. We'll show you where the quickest wins usually are for a team like yours, with no data required and no obligation.
- Free 20-minute assessment
- NDA before any data is shared
- Fixed-scope quote, 30/70 payment terms
- 7 days of post-delivery support