Clarity Softworks replaced a $2,500/month monitoring bill with a self-hosted stack
An 85-person SaaS company moved from a commercial per-host monitoring platform to a self-hosted Grafana, Prometheus, Loki and Tempo stack. Licence cost went to zero; the new stack runs on about $310 a month of infrastructure.
- B2B SaaS product company
- 85 people · Mid-size
- Dubai, UAE
- 6 weeks
Monthly spend
- Saved / month
- $2,190
- Reduction
- 88%
- Payback
- 7 weeks
$26,280
Annual saving
$0
Licence cost
−64%
Log volume
13 months
Retention
The challenge
Clarity's monitoring bill had tripled in eighteen months as it added hosts, custom metrics and log volume. Every new microservice made the bill bigger, and engineers had started avoiding instrumentation to keep costs down.
The team wanted the same dashboards, alerting and tracing without per-host and per-GB pricing, but worried that a migration would leave them blind during the switch.
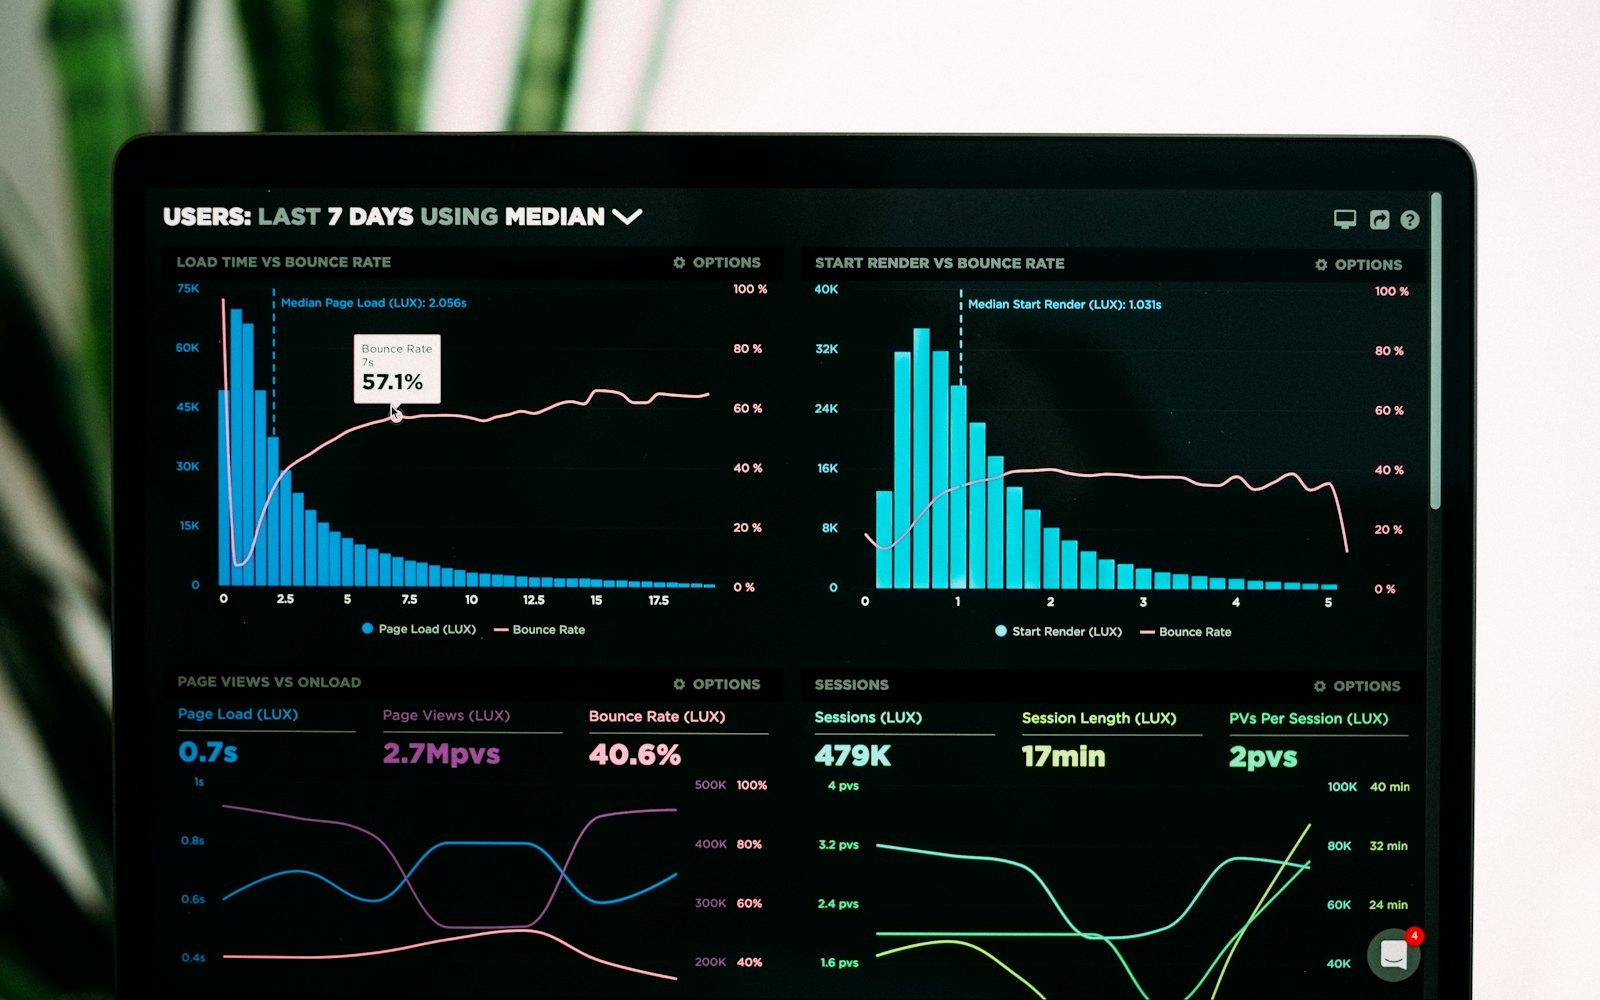
What we reviewed
- Monitoring invoices and usage breakdown for 18 months
- 64 hosts, 1,900 custom metrics and log ingestion volume
- Existing dashboards, monitors and on-call routing
- APM coverage across 22 services
- Kubernetes cluster capacity for self-hosting
The approach
- 1
Design an equivalent open-source stack
Prometheus for metrics, Loki for logs, Tempo for traces and Grafana for dashboards and alerting, instrumented through OpenTelemetry so the team is never locked in again.
- 2
Run both stacks in parallel
For three weeks both platforms ran side by side. We rebuilt the 48 dashboards and 112 alerts that mattered and retired 300 that nobody had opened in months.
- 3
Cut log volume at the source
Debug-level logs in production, health-check noise and duplicate request logs were filtered before ingestion, reducing volume by 64%.
- 4
Tier long-term retention
Recent data stays on fast disk; older logs and metrics move to inexpensive object storage, keeping 13 months of history for audits.
Before and after
Monthly cost by line item, in US dollars.
Clarity Softworks — monthly observability spend
Monthly| Line item | Before | After | Saving |
|---|---|---|---|
| APM and infrastructure monitoring licences | $1,380 | — | −$1,380 |
| Log ingestion and indexing | $720 | — | −$720 |
| Synthetic and uptime checks | $180 | — | −$180 |
| Custom metrics overage | $220 | — | −$220 |
| Self-hosted stack compute (Grafana, Prometheus, Loki, Tempo) | — | $240 | +$240 |
| Object storage for long-term retention | — | $70 | +$70 |
| Total | $2,500 | $310 | $2,190 (88%) |
Monthly spend over time
$26,280 saved per yearTwo months before the engagement, then six months after the plan was delivered.
Timeline
Week 1
Inventory
Every dashboard, alert and integration catalogued and ranked by use.
Weeks 2–3
Parallel build
New stack deployed and fed alongside the existing platform.
Weeks 4–5
Validation
Alert parity confirmed through two real incidents and a game day.
Week 6
Cut-over
Commercial platform cancelled at renewal; runbooks handed over.
“We kept every dashboard our on-call team actually uses and lost the bill. The parallel-run approach meant there was never a day we were flying blind.”
Related case studies
All case studies Observability
Monthly spend
₹2.4L → ₹1L
Cobalt Interactive · 52 people · Kolkata
Cobalt Interactive cut monitoring costs by 58% through log volume and retention tuning
Read case study DevOps & CI/CD
Monthly spend
₹3.2L → ₹1.2L
Fingate Solutions · 140 people · Mumbai
Fingate Solutions cut CI/CD build costs by 62% with caching and self-hosted runners
Read case study DevOps & CI/CD
Monthly spend
₹3.6L → ₹2.3L
Veridian Tech · 48 people · Chandigarh
Veridian Tech saved 35% by streamlining pipelines and consolidating tools
Read case studyFind out what your agency could save
Book a 20-minute call. We'll show you where the quickest wins usually are for a team like yours, with no data required and no obligation.
- Free 20-minute assessment
- NDA before any data is shared
- Fixed-scope quote, 30/70 payment terms
- 7 days of post-delivery support